Next Gen CDS
for Waters Corporation
Project Overview
Working with customers, Project Owners, and software developers to create a user-friendly interface for the flagship chromatography data system (CDS) software program that creates over $200m annual income for the company. The software that is currently used across the industry is outdated to the point that it cannot be re-skinned. An entirely new Cloud-based software program needs to be created.


Timeline
Ongoing
Tools
Axure
AdobeXD
Zeplin
JIRA
Confluence
Platform
Cloud-based Software Program
Deliverables
Wireframes, low and high fidelity prototypes with iterations, research sessions (from ideation to usability), presentations to software development teams, customers, and shareholders.
My Role
Competitive analysis research, interviews with customers and project owners, creating wireframes, low & high fidelity prototypes, conducting prototype demos, explorative and usability research sessions, iterations in design based on user feedback, Axure, Adobe UX designs, and Zeplin exports for software developers to code.
DISCOVER
Problem Statement
Scientists in the laboratory need a way to conduct their experiments in an easy-to-use way because the industry is changing rapidly. They need quick adoption and faster processes to keep up with demand and government regulations.
Solution Statement
We believe that by creating an update and expansion to the Empower software program, we will help scientists streamline their processes and retain customers for Waters Corporation.
We will know this to be true when we see a 30% increase in customer demand and 20% increase in satisfaction in beta research sessions.
Research
Interviews
34 Administrators
100+ Scientists
Interview Insights: The current programs we have are very outdated and hard to use. The lab tech employees are changing in this industry. Many are coming out of 2 year Associate programs instead of Ph.D. trained at universities. The younger workforce is also used to more user-friendly interfaces in their daily lives. The software we currently have is not conducive to this new type of lab tech. In order to stay ahead in the market, pivoting to an updated and user-friendly interface is essential.
“I like your software compared to your competitors because it can do everything I need it to do... just needs to be updated."
Research Insights
There are a lot of parts to this project: creating methods, the processing of results, the reviewing of data collected during processing by the lab technicians.
LEGACY SOFTWARE
Empower
Empower Software, is the flagship chromatography data system (CDS) for Waters Corporation. This product generates over $200m profit for the company annually, but is in dire need of an update.
Original Empower software


Updated slightly, but still confusing to new users.
UNIFI
UNIFI was the first software platform to merge LC and high-performance MS data (both quadrupole and time-of-flight) into a single solution that encompasses data acquisition, processing, visualization, reporting, and configurable compliance tools within a networked laboratory environment. Unfortunately, the research on usability was not present and customers found the interface too overwhelming and not easy to use. The UX team was created to help alleviate these issues.

PROJECTS
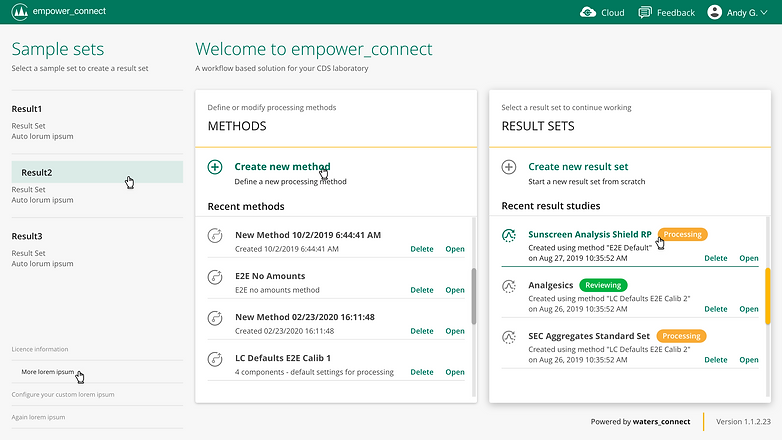
Creation of home screen
The home screen needs to be designed with the idea of consistency with the 16+ other applications currently being designed as well as usability for the scientists and the ability to easily import data, create new methods, result sets, process the injection information and then review the processing results. Cloud-based software that needs to be responsive with breakpoints at 1280px (small screen), and 768px (iPad/tablet size).
Full screen:1920 x 1080 px - Zeplin export

Small screen:1280 x 720 px - Zeplin export

iPad screens: 768 x 1024 px - Zeplin exports


Calibration curves
The calibration curves are one of the most important parts of the software because it helps the scientists analyze the data to see where the discrepancies lie in their product.
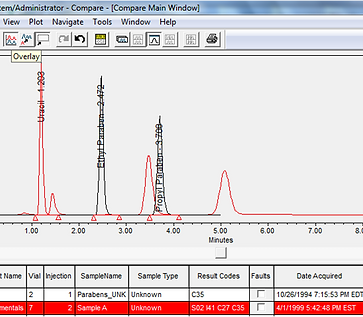
When I joined the team, they had overlapping text in the chromatogram and were not sure what to do. I came up with the idea of "flags" at the top of the peaks which show which chromatogram peak is selected. I also recommended they increase the contrast of the shaded area to accommodate for visually impaired or colorblind people.
I then did research sessions with customers and internal SMEs to validate this design idea. The team was very appreciative of my help and this helped me get buy-in for UX on the team.
Original Empower chromatograms

Updated chromatogram UI design

Creating methods
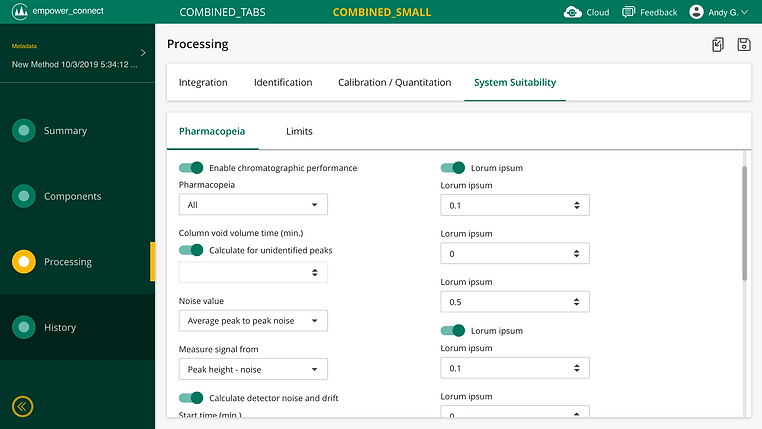
A recent issue on a processing page was that the team had to add more input fields than space could accommodate. This was pushing the Limits table too far down to be visible. Upon talking with the team more, they said that they might look into creating a separate tab for the information, but wanted to see what the options were. I know that the information also needs to accommodate the smaller screen sizes, so I wanted to make sure to show the team the options in the smaller screen sizes as well. They will most likely be going with the tabbed option based on my recommendation.
Initial issue with too many text fields
.png)
Suggestion with text fields spaced better

Suggestion with tab idea - Limits put on separate tab

Suggestion with tab idea - Smaller 1280 x 720 px screen

Video showing different format options presented to the team for feedback
Data Review
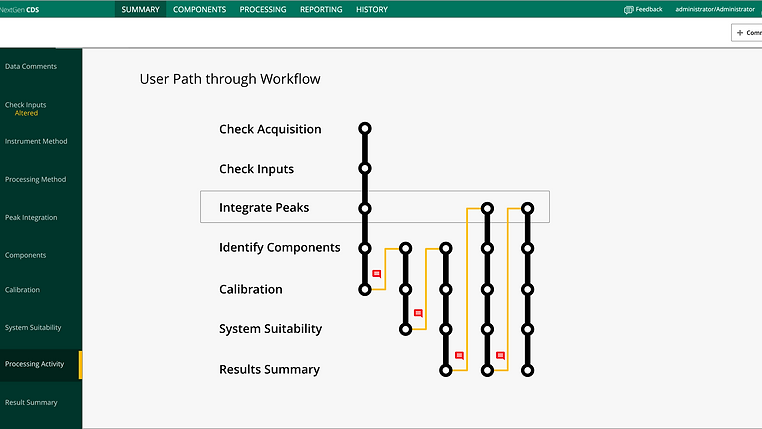
When the lab technician is done processing the information the results are given to a Data Reviewer in order to make sure that all the information was processed correctly. This is due to government regulations as well as safety concerns. The products that are processed through this software are everything from pharmaceutical drugs, to cosmetics, to food that is being tested for toxicity.
Initial Data Review "Processing Activity Map" based on Project Owner whiteboard sketches

Iteration - adding collapsable legend on right side for clarity and "Processing" and "Review" on left side to quickly view the interactions on the map. Scrollable areas to accommodate for when the processing and review steps become too large for the provided space.

Next Steps
Projects that have spun off from this project: Data Trending, Workflow Builder, and Custom Field Calculations. This project is slated to be released into the market within the next couple of years. There is already a high demand for the product and a waiting list. We have high-end beta testers working with the system to provide feedback as we iterate on the project.
